
The Monthly Economic Report for June was ready and posted on July 1st before I was even awake here on the west coast of the United States. I suggested at the end of my recent month in review post that we were entering the sleepy stretch of summer when many at CCP take trips, but apparently CCP Estimate was still in the office and hard at work.
EVE Online nerds harder
One of the fresh bits with this MER is that some of the charts are now available in “dark mode,” with a black background, which I am very much in favor of. They aren’t all available as such, but where they are, and where it makes the charts easier to read with my old eyes, I will be running with those.
Production
I will open here as usual with one of the charts now done up in dark mode.

June 2022 – Production vs Destruction vs Mined (at night!)
As noted last month, when this updated version of the chart arrived, I do like the break out by security band sub-charts and will break them out on their own.
Production stayed steady in the post capital blueprint change era through most of June, though you can see it dropping off a bit towards the back half of the month. The data for that chart shows total production at 81.28 trillion ISK in value, up slightly from the 80.25 trillion ISK recorded in May.
The data from the regional statistics shows that the top ten regions for production in June were:
- The Forge – 17.39 trillion (High Sec)
- Delve – 12.8 trillion (Imperium)
- Vale of the Silent – 11.01 trillion (Fraternity)
- Lonetrek – 7.13 trillion (High Sec)
- The Citadel – 5.7 trillion (High Sec)
- Tribute – 5.14 trillion (Fraternity)
- Fade – 4.15 trillion (WE FORM BL0B)
- Heimatar 3.58 trillion (High Sec)
- Domain – 3 trillion (High Sec)
- Sinq Laison – 2.87 trillion (High Sec)
The regional data totaled up to 110.591 trillion ISK in value produced for the month, up from the 105.9 trillion that last month rang in, so production was looking up a bit. But that end of month down turn in the first chart makes me wonder if it will continue to trend down into July.
And, as promised, I broke out the sub-charts.
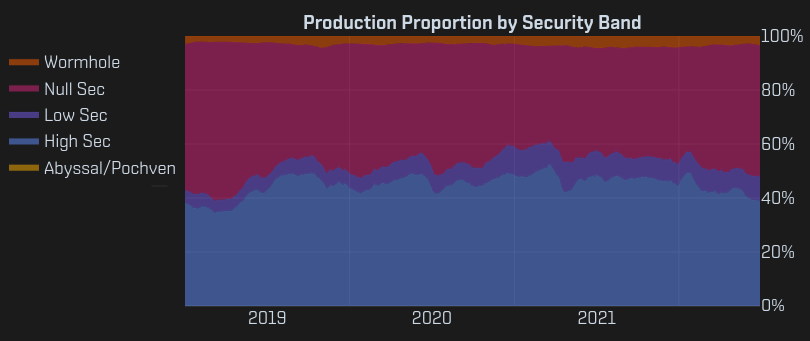
June 2022 – Production by Security Band
I don’t know that I will want/need to break them out every month, unless I feel the need to remind people where production happens, which looked to be primarily a split between null sec and high sec.
Destruction
June saw the end of the Imperium SIG incursion into the southeast of null sec, followed by a quiet period after which the Imperium mobilized for a larger strike against FI.RE and its PAPI allies. The question was really whether that month would be dominated by the campaigns or the lull in between. The regional destruction stats showed the following as the top ten most destructive regions:
- The Forge – 1.49 trillion (High Sec)
- Pochven – 1.45 trillion (Triglavian)
- Vale of the Silent – 1.31 trillion (Fraternity)
- Pure Blind – 1.24 trillion (Brave/V0LTA)
- Lonetrek – 1.11 trillion (High Sec)
- The Citadel – 1.07 trillion (High Sec)
- Delve – 1.03 trillion (Imperium)
- Metropolis – 878 billion (High Sec)
- Sinq Laison – 805 billion (High Sec)
- Genesis – 770 billion (High Sec)
None of the regions in the southeast null sec conflict made the top ten, and the overall destruction, ringing in at 27.08 trillion ISK, down from 32.37 trillion ISK in May, seems to indicate that the lull was the major null sec theme for June.
Likewise, the data from the Production/Destruction/Mined chart at the top of the post showed 21.45 trillion ISK in destruction, down from 30.65 trillion in May, though there was a blank day in the data. Still, the trend was clearly down.
And the broken out security band chart for destruction certainly doesn’t show null sec swelling in percentage.
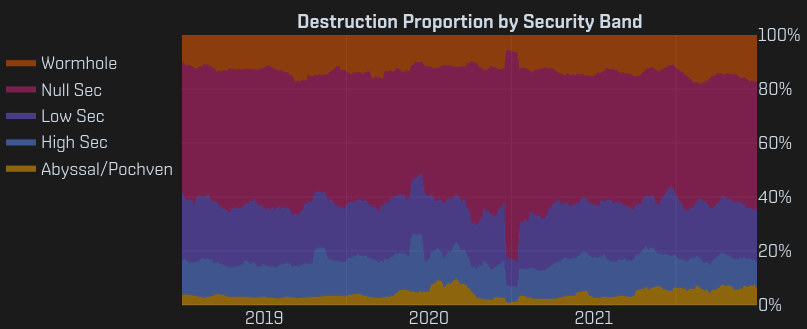
June 2022 – Destruction by Security Band
Will the full on Imperium campaign shift the null sec numbers upwards? PAPI seems mixed on whether to fight the Imperium or run up north to Pure Blind to beat on Brave and V0LTA.
Trade
Trade, after seeing some gains in May, fell off again in June, with the regional data showing a total of 533.04 trillion ISK in trade, down from the 595 trillion ISK recorded in May.
The top ten regions remained the usual suspects, the high sec trade hubs, the null sec coalition capitol regions, and the Caldari high sec regions adjacent to Jita.
- The Forge – 391.69 trillion (Jita)
- Domain – 34.51 trillion (Amarr)
- Delve – 15.5 trillion (Imperium)
- Lonetrek – 14.72 trillion (Caldari High Sec)
- Sinq Laison – 12.07 trillion (Dodixie)
- Metropolis – 9.14 trillion (Hek)
- Perrigen Falls – 7.38 trillion (PanFam)
- Heimatar – 5.92 trillion (Rens)
- Vale of the Silent – 5.22 trillion (Fraternity)
- The Citadel – 4.24 trillion (Caldari High Sec)
As an additional tidbit, this chart about the most traded items over the last 12 months in New Eden showed up on Twitter.
https://twitter.com/OZ_in_EVE/status/1543378013810827264
PLEX and Large Skill Injectors remain far and away the top items, and since they are most commonly traded in Jita or Perimeter, that is likely what keeps The Forge so far ahead in trade. One wonders what the trade numbers would look like with those two items, and the related market items, removed from the equation. I supposed I could go back and add up the last 12 months of trade and figure that out, but I won’t.
ISK Faucets
Once more into the money side of the equation, and how it flows into New Eden. As usual, the top of the big ISK chart cropped.
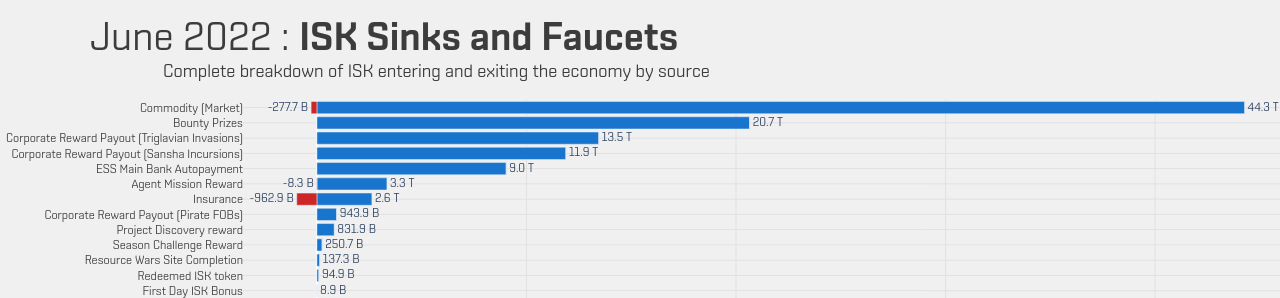
June 2022 – Faucet end of the chart big chart
For those who cannot read the chart, which includes me, the top items listed are (with the change over last month in noted):
- Commodity – 44.3 trillion (down 7 trillion)
- Bounty Prizes – 20.7 trillion (down 2.6 trillion)
- Trig Invasion Payouts – 13.5 trillion (up 0.4 trillion)
- Incursion Payouts – 11.9 trillion (down 2.1 trillion)
- ESS Bounty Payouts – 9.0 trillion (down 0.7 trillion)
- Agent Mission Rewards 3.3 trillion (down 0.3 trillion)
Save for ongoing fun in Pochven, things seemed down on the faucet front. Commodities was perhaps explainable due to the face that there was an event associated bubble for them in May. You can see the miscellaneous line jump then fall off as June arrived in the chart below.

June 2022 – Top Commodity Items Over Time
But overall you can see the main faucets trending down in June.
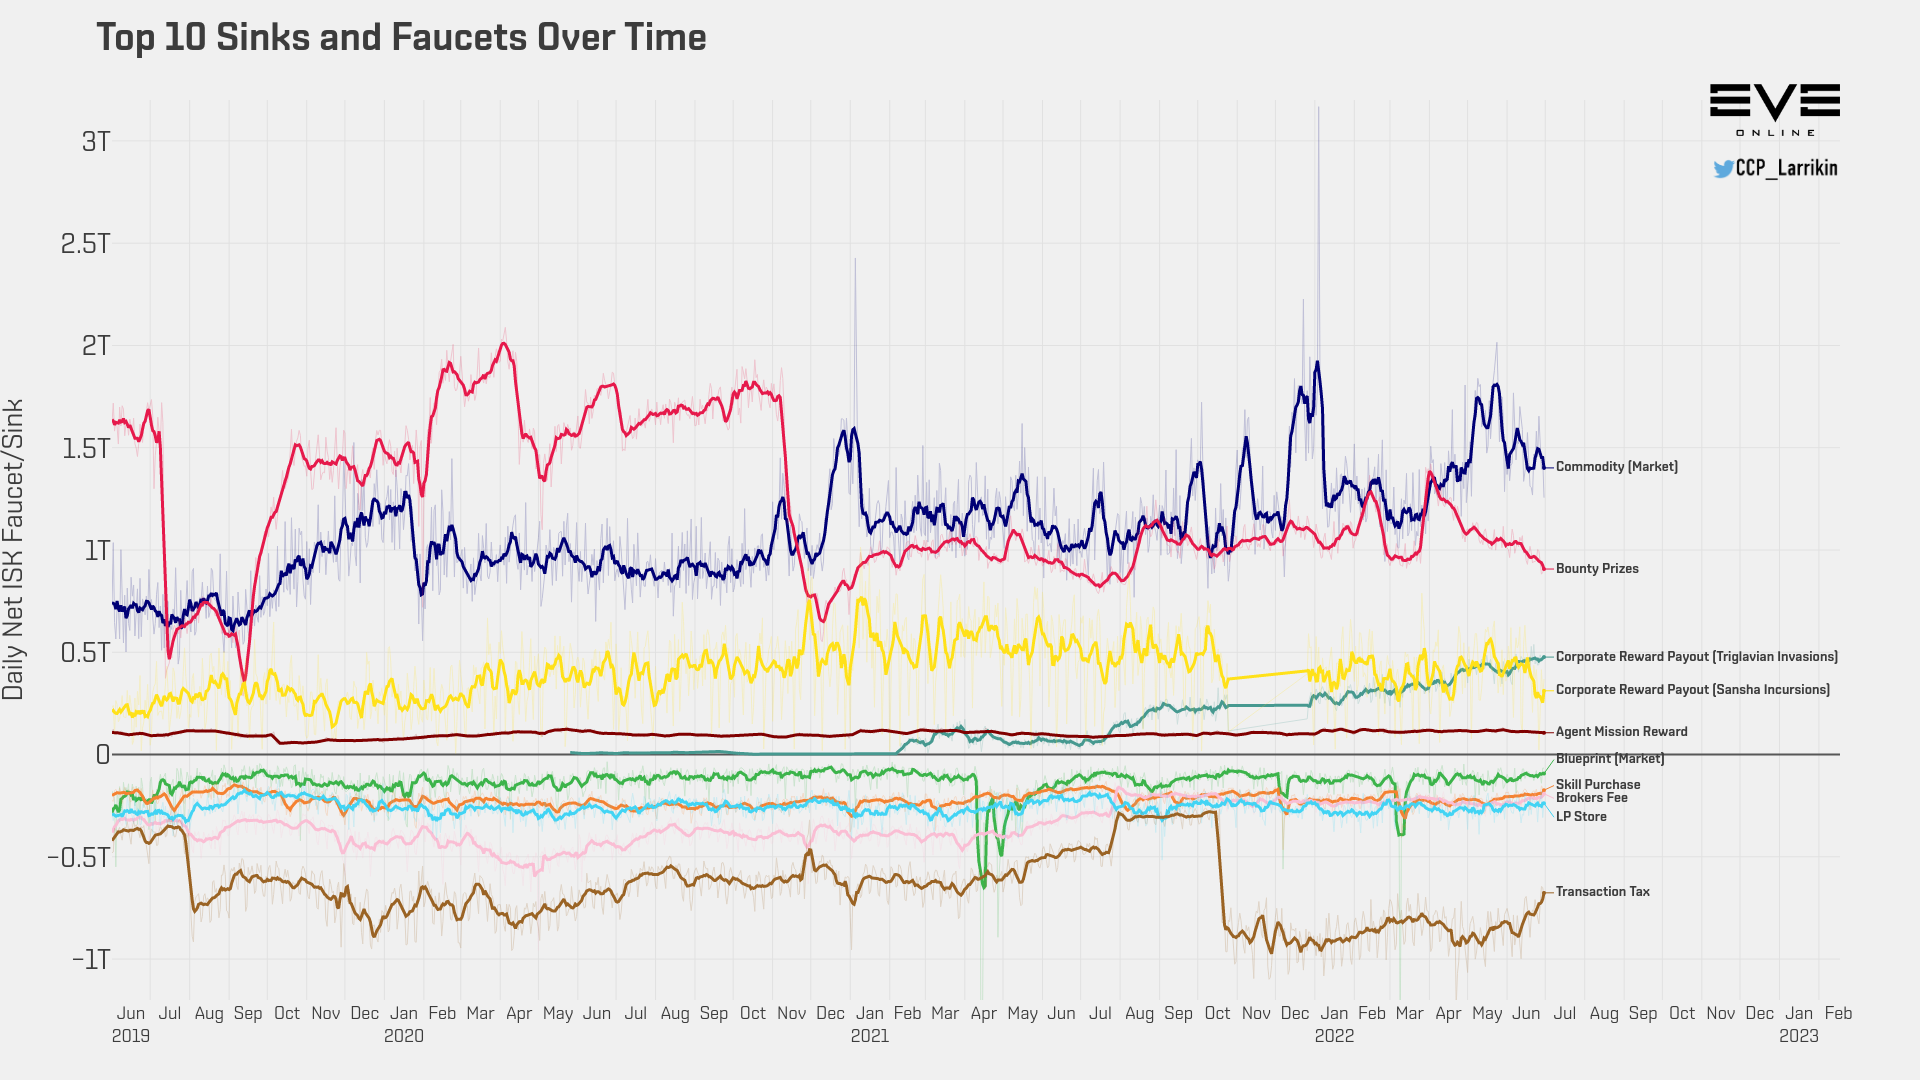
June 2022 – Top Sinks and Faucets Over Time
The line for bounties seemed to be on a multi-month decline at this point. The top regions for NPC bounties were:
- Vale of the Silent – 2.2 trillion (Fraternity)
- Delve – 1.61 trillion (Imperium)
- Perrigen Falls – 1.59 trillion (PanFam)
- The Kalevala Expanse – 1.44 trillion (PanFam)
- Fountain – 1.28 trillion (Imperium)
- Querious – 1.06 trillion (Imperium)
- Catch – 957 billion (Imperium/Others)
- Malpais – 937 billion (PanFam)
- Pure Blind – 931 billion (Brave/V0LTA)
- Insmother – 871 billion (FI.RE)
Overall the regional stats add up to 27.9 trillion ISK in bounties, down from 32.06 trillion ISK in May.
It was one of those rare months when more ISK came out of the game than went in.

June 2022 ISK balance
That compares to May, when 120.5 trillion ISK came into the. But ISK sinks were also down from May, by close to 9 trillion ISK. The chart shows that transaction taxes were taking less out of the economy.
The big change was the Active ISK Delta, which represents players going idle in the game as well as ISK CCP has seized from players for violating the EULA and Terms of Use for things like illicit RMT.
So the money supply, which had been on a up line recently, flattened out in June.
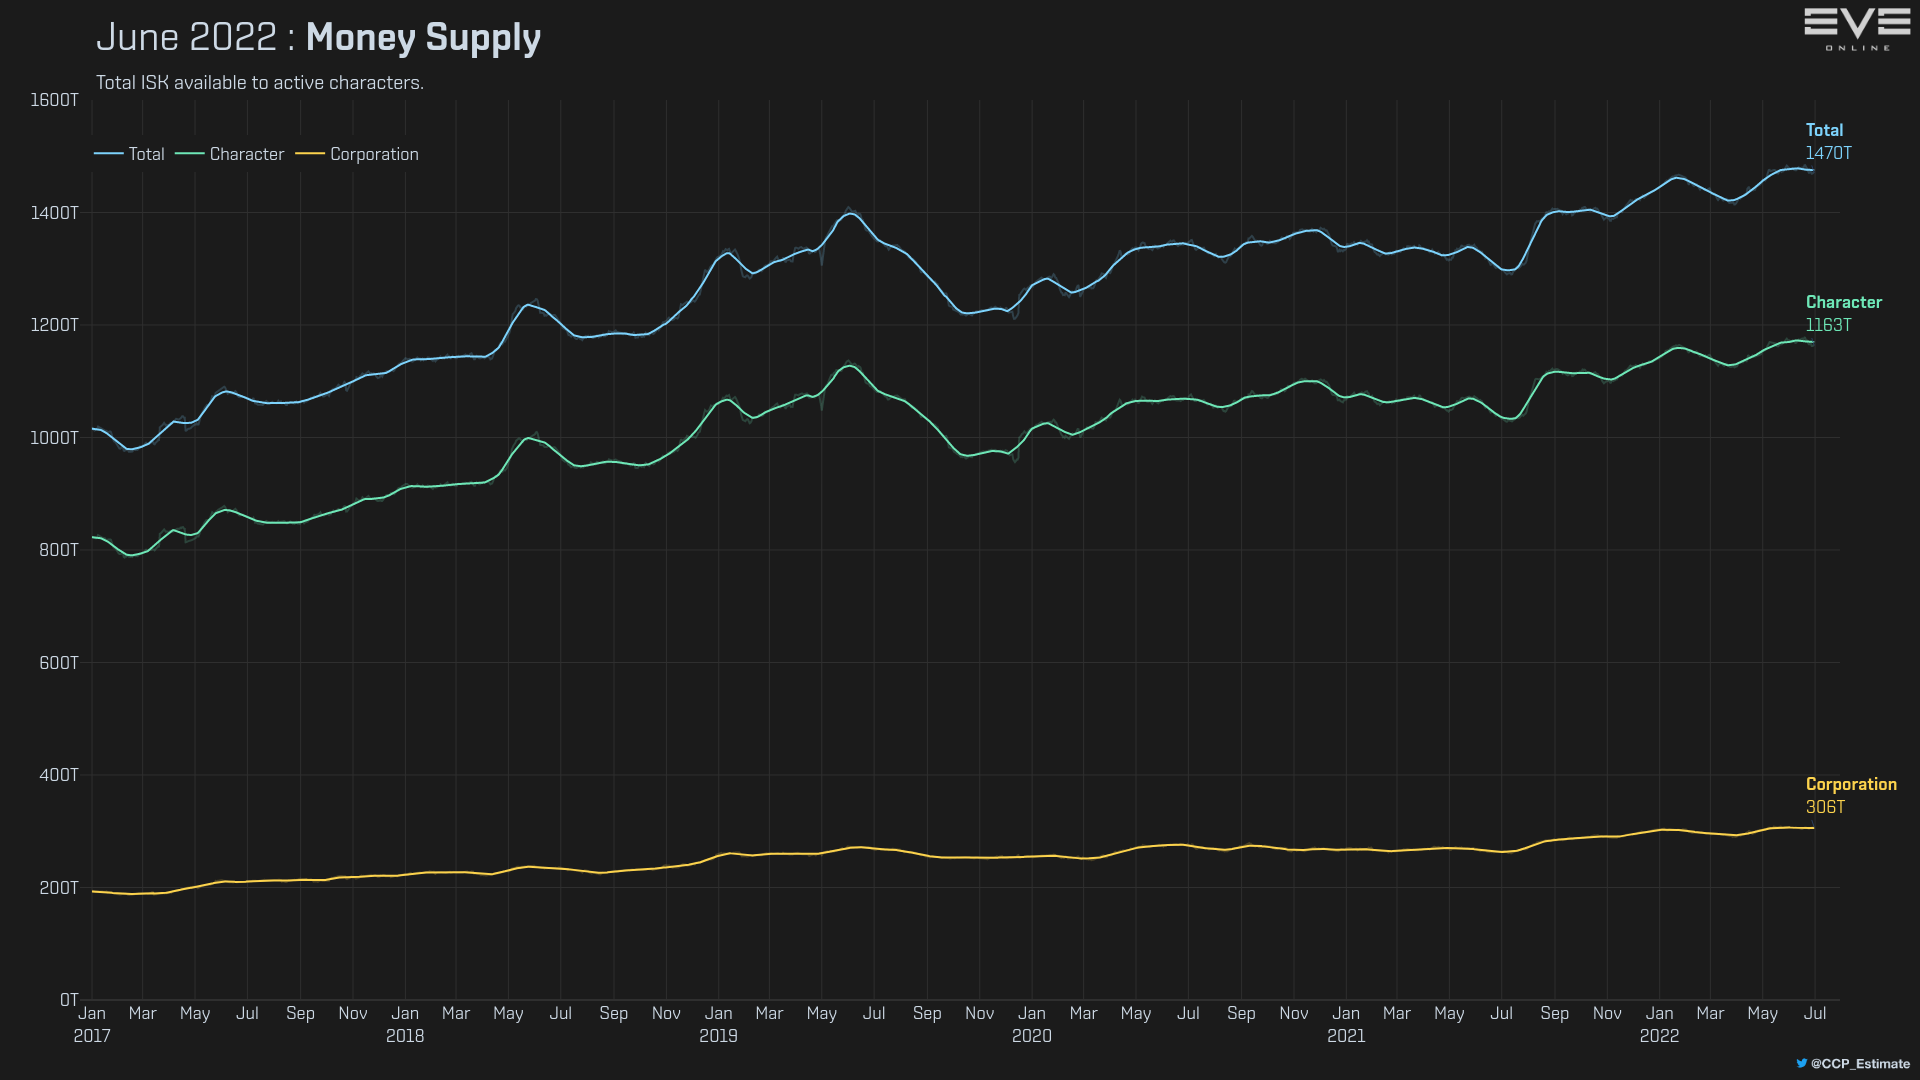
June 2022 – Money Supply (in the dark)
Meanwhile, the velocity of ISK, the measure of ISK turn over in the market, took something of a dive as well in June.

June 2022 – Velocity of ISK (some like it dark)
That dive started in May, but was clearly not arrested by anything that happened in June. May was when we go the subscription price increase as well as the Fanfest of promises but no action.
[Edit: And just before this post went live CCP posted an update indicating that they plan to spend to summer talking about the things they didn’t deliver at Fanfest. So… Yay consistency I guess?]
And the primary driver of trade, ISK faucets, and content in general is players in the game, which has also been falling off of late. (Chart from EVE Offline)

The state of the PCU in June 2022
Again, we might just be in the summer slump. But we won’t know until we get to autumn.
As for other items, while I find the ESS charts interesting, they do replay pretty much the same story every month. In June, as in May, the largest reserve bank heist was an alliance draining its own local banks. Those charts are in the MER download package if you want to see them. I don’t think I need to post them every month unless there is a change up or something amusing happens.
Mining
Overall mineral prices remained on their recent upward climb.
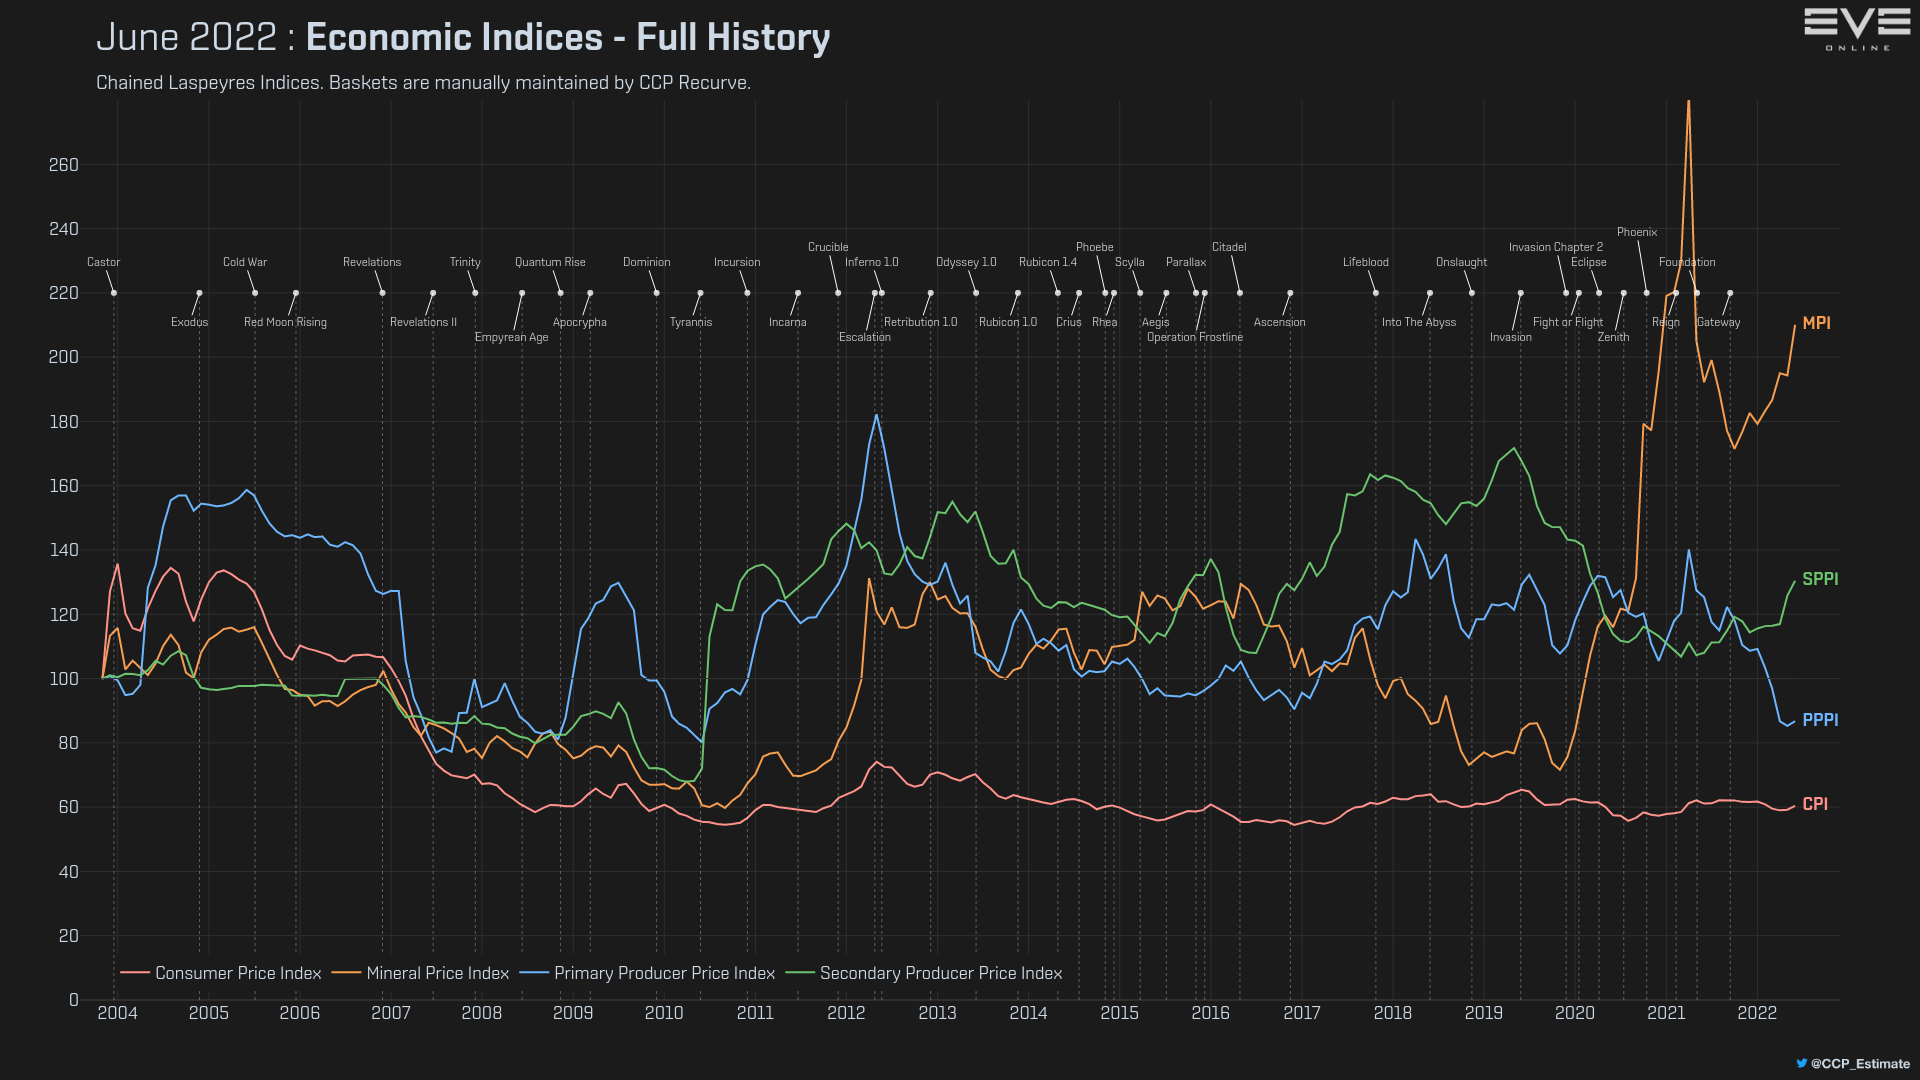
June 2022 – Economic Indices (dark)
Mineral prices remain below their starvation economy peak, but are still higher than any past historical period in the game. However, mining overall appears to be down.
The regional stats show the following as the top ten regions for mining:
- Vale of the Silent – 1.05 trillion (Fraternity)
- The Forge – 660 billion (High Sec)
- Domain – 654 billion (High Sec)
- Delve – 618 billion (Imperium)
- Metropolis – 597 billion (High Sec)
- Lonetrek – 534 billion (High Sec)
- Aridia – 529 billion (Low Sec)
- The Kalevala Expanse – 522 billion (PanFam)
- Malpais – 493 billion (PanFam)
- Sinq Laison – 422 billion (High Sec)
The only real surprise on that list is Aridia, the low sec region that happens to be adjacent to Imperium space in Delve and Fountain. But we’ll get to what that might have made the cut in a moment.
Overall the regional stats added up to 16.46 trillion ISK value mined, down from 17.84 trillion ISK in May. But the data from the Produced/Mined/Destroyed chart way up at the top says that 27.69 trillion ISK in value was mined, up from 21.77 trillion ISK in May.
What doesn’t get included in the regional stats but probably gets pulled into the overall stats? Wormhole space maybe? You can see WH space spike at the end of the overall mining by security band chart.

June 2022 – Mining by Security Band
And what does Wormhole space have to offer? Gas!

June 2022 – Gas mining over the last 12 months by volume mined
You can see on that chart that gas mining has been climbing, at least through until the middle of June, both in wormhole space and low sec. Gas is directly associated with capital production, and with the capital blueprint changes that came in in May, there has been a drive to restart capital production.
I cannot speak to other groups, but in the Imperium there have been classes in how to mine gas and a request that those with a mind to do so go out and get in on the gas harvesting gold rush. This probably explains why Aridia, a low sec region close to the Imperium with gas resources needed for production, made the top ten list.
If gas is up, what is going on with everything else? Asteroid mining seems to be settling into a slight downward trend.
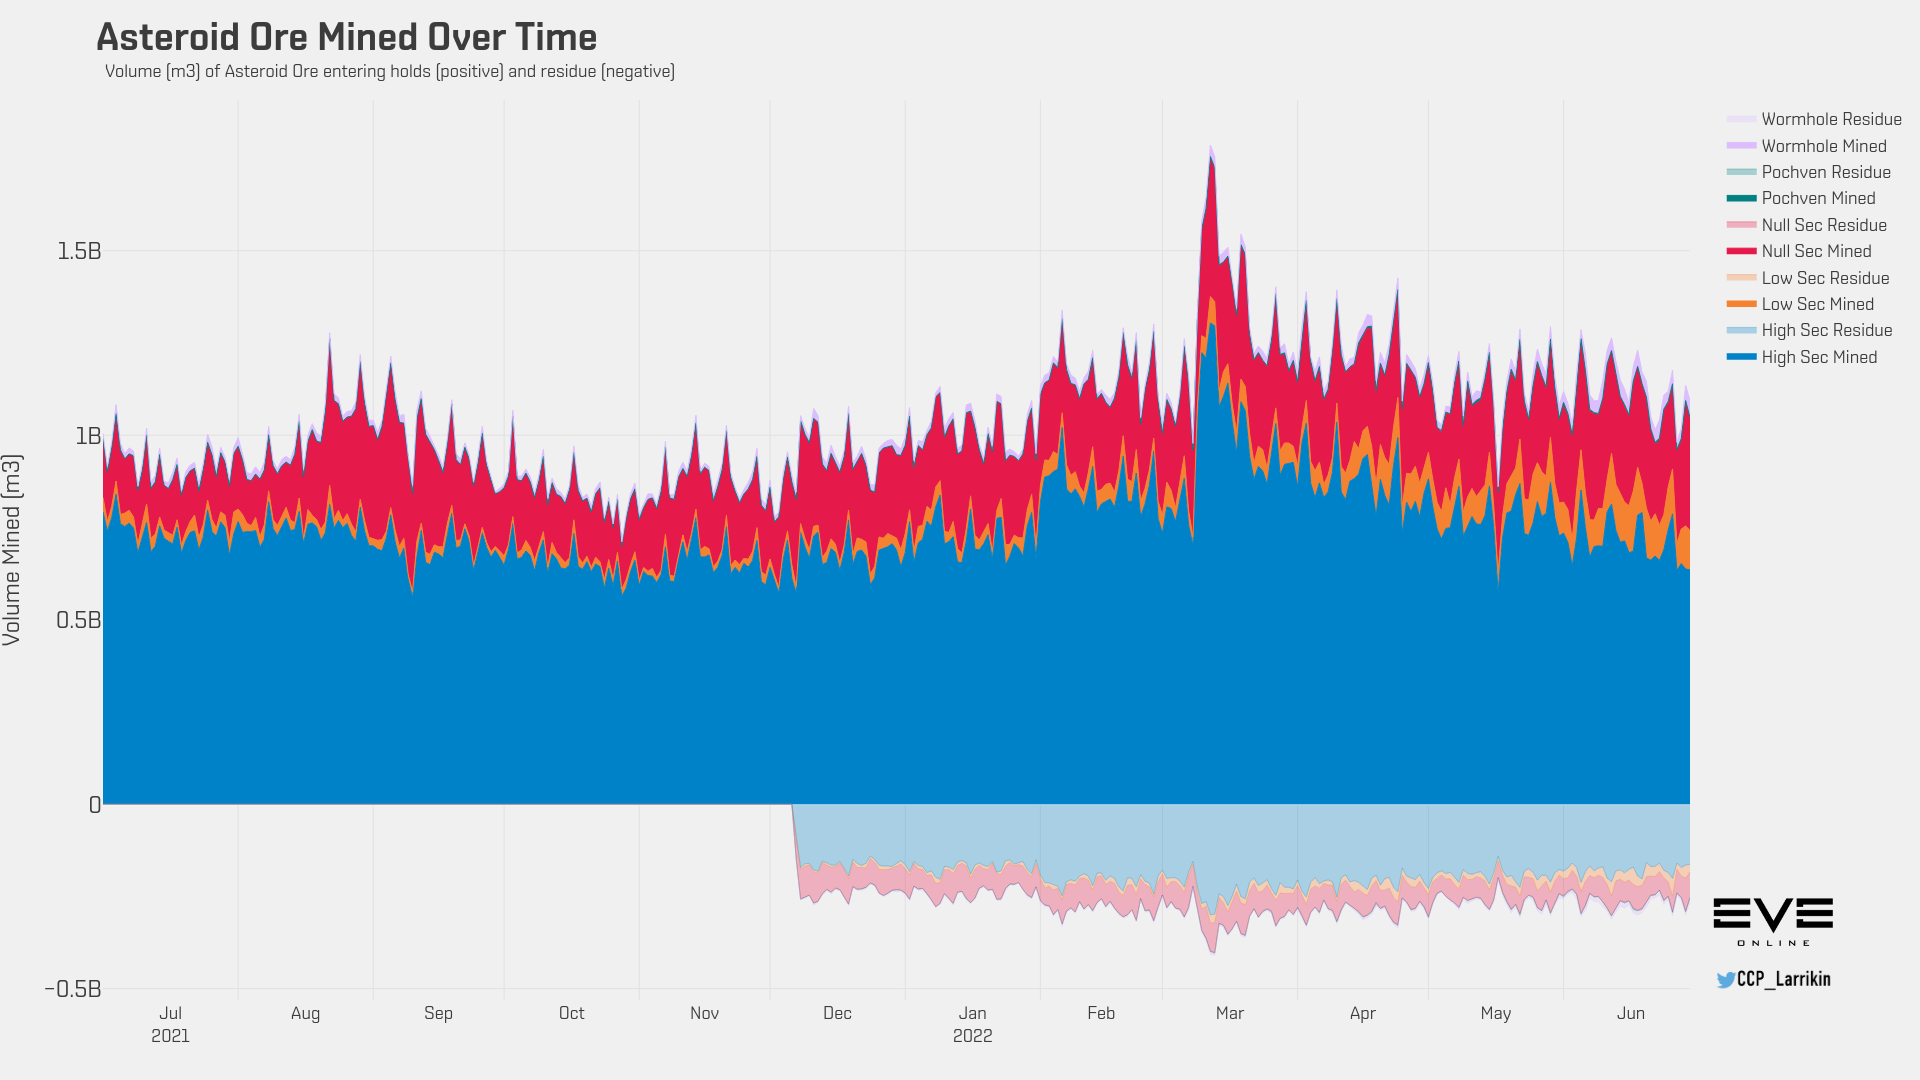
June 2022 – Asteroid mining over the last 12 months by volume mined
Ice mining likewise seems to have started down a slight decline over time. Not enough capital move ops I guess.

June 2022 – Ice mining over the last 12 months by volume mined
And moon mining also seems to be down a bit from its recent peak.
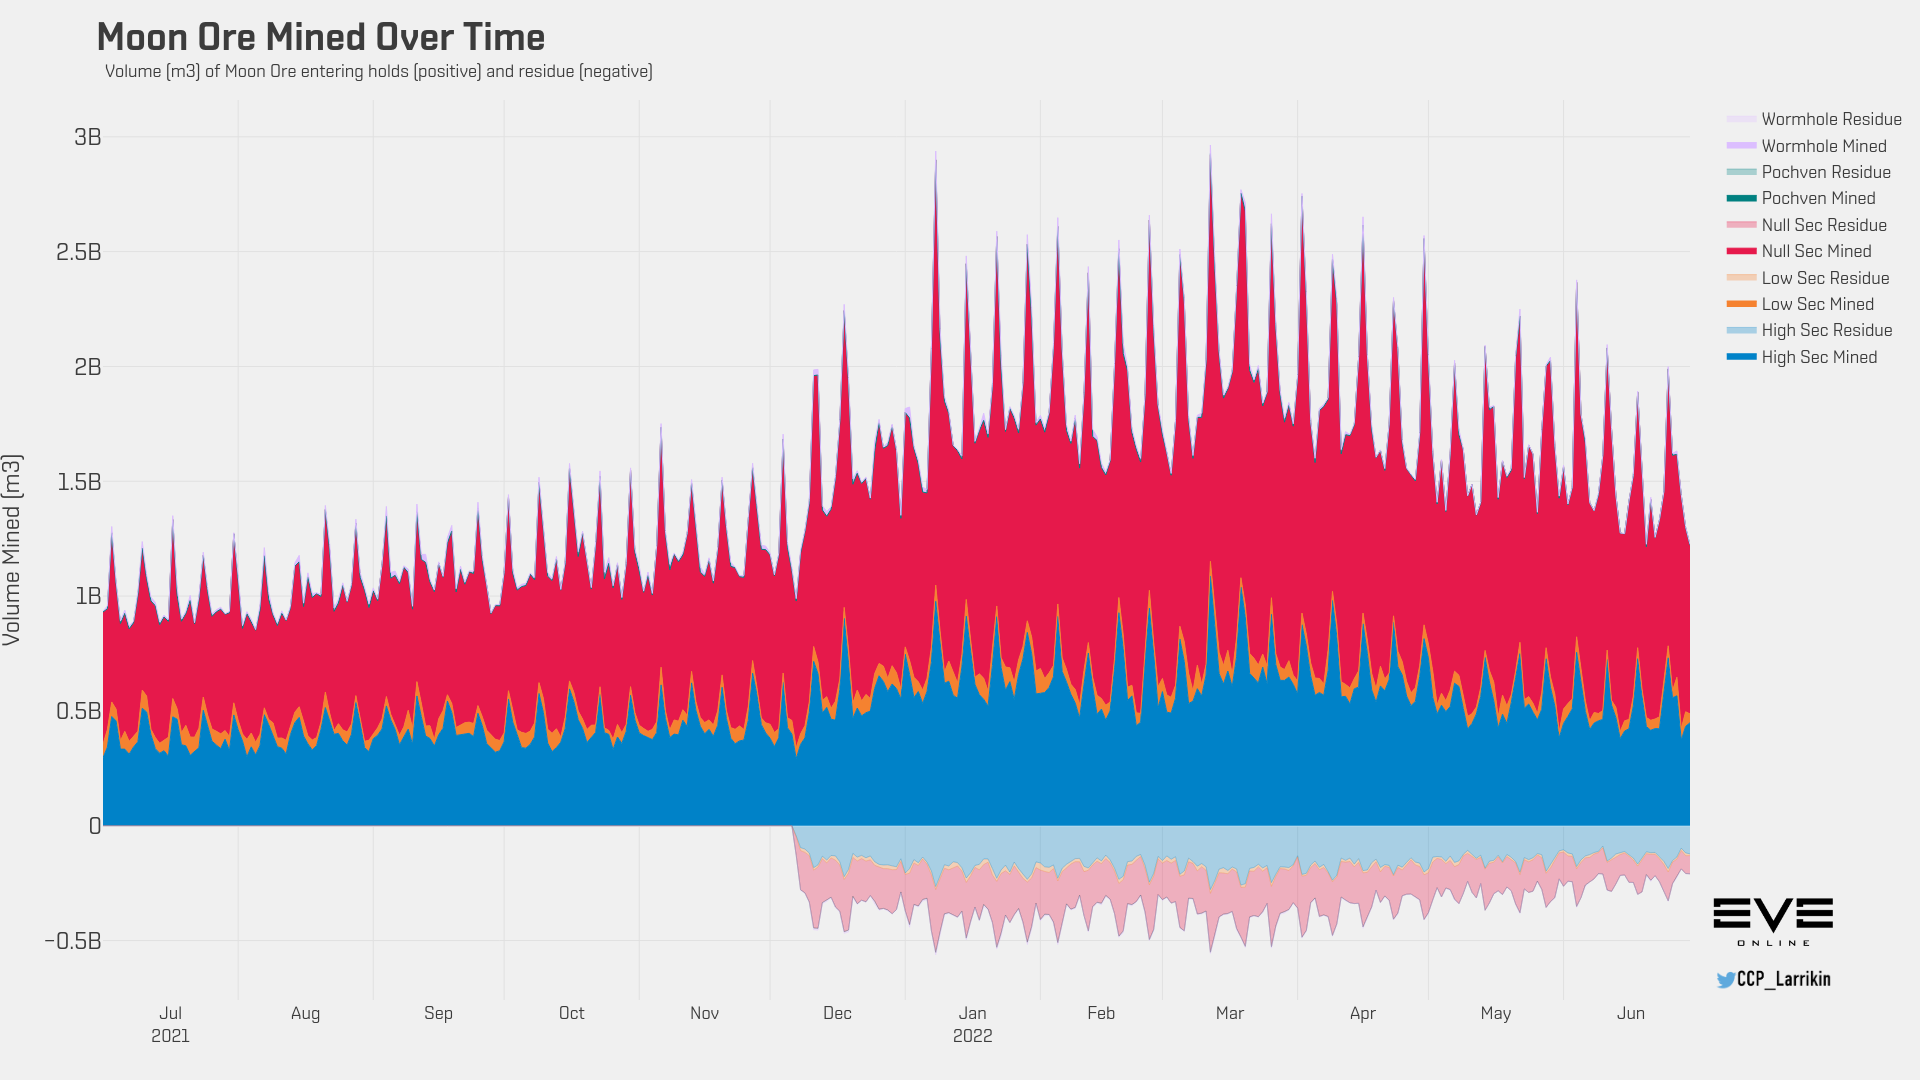
June 2022 – Moon mining over the last 12 months by volume mined
We did get some additional data as part of the MER this month, as a new column appears in the regional data for moon mining. The top ten regions for that were (updated because I was initially off by an order of magnitude… millions not billions):
- Vale of the Silent – 321 million (Fraternity)
- Delve – 257 million (Imperium)
- Domain – 198 million High Sec)
- The Kalevala Expanse – 182 million (PanFam)
- The Citadel – 154 million High Sec)
- Insmother – 140 million (FI.RE)
- Tribute – 137 million (Fraternity)
- Perrigen Falls 137 million (PanFam)
- Malpais – 134 million (PanFam)
- Metropolis – 119 million High Sec)
Overall a total of 3.995 billion ISK in value was recorded as being mined from moons in June. While we do not have any historical data yet, we can at least see where moon mining is happening. Null sec accounts for the largest share, with the usual groups appearing in the top ten.
But high sec still has a big share of the haul, with regions near trade hubs that have some 0.5 security systems, required to moon mine in high sec, making it into the top ten.
You have to go quite a ways down the list to find a low sec region on the regional list, though the region in last place is Pochven, with 165,280 ISK in moon mining value, which is kind of crazy if only because somebody was trying to moon mine there… and didn’t do very well.
So it goes. Another month has gone by.
As usual, you can find all these chart and data and much more in the download packages linked on the MER Dev Blog.
Related:
- CCP – Monthly Economic Report for June 2022
- CCP – June MER Forum Thread
- Reddit – June MER Discussion Thread
- TAGN – Last month’s MER post for comparisons
